


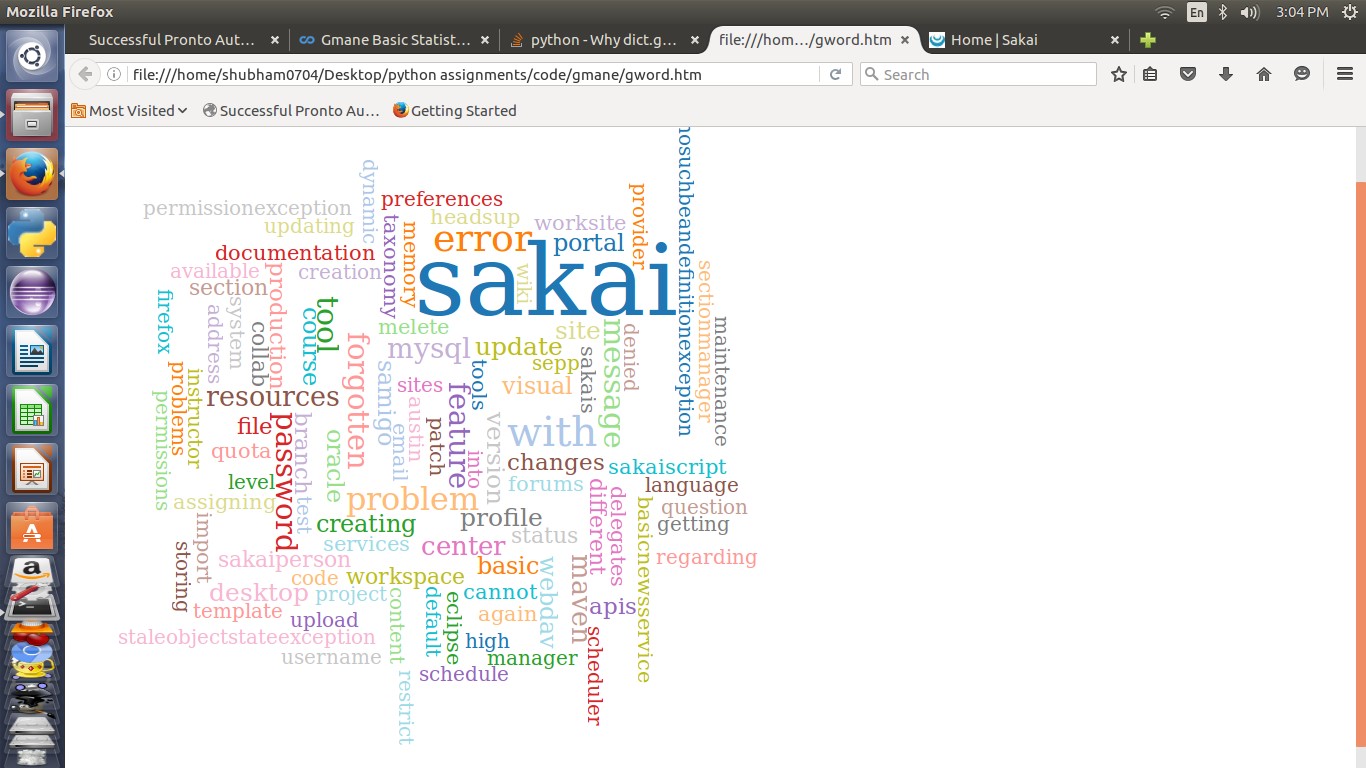
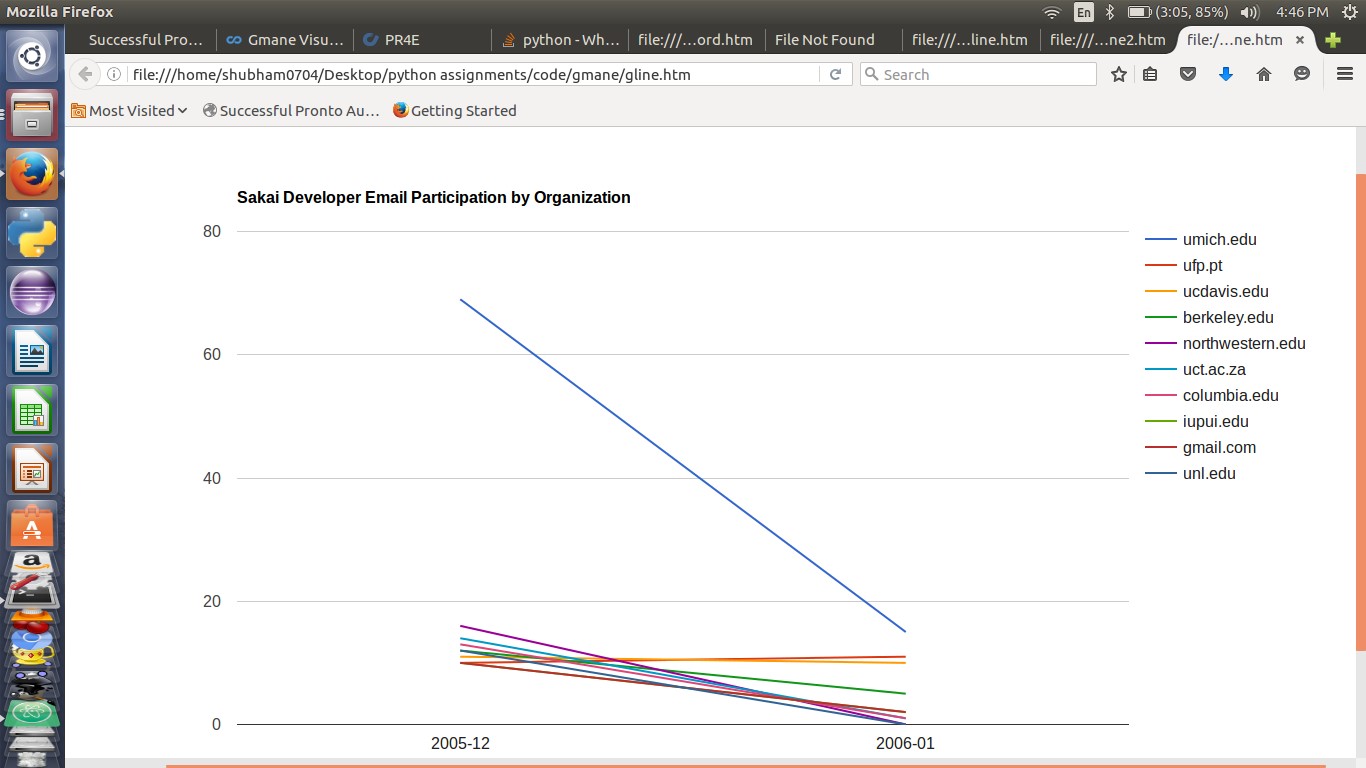
This project is based on data mining and visualization.I took a sample data set consisting of email messages recorded over 6 yrs data of people communicating over a open source LMS called SAKAI. Then I refined it and stored it in a database and used d3.js for visualization.Here I used the word cloud. The word cloud visualization is an engaging way to visualize a frequency distribution or histogram. The second visualization will be to show how the data is changing over time.


.jpg)
 1
1 2
2 3
3 4
4 5
5 6
6